Analytics
Analytics transforms raw session and commit data into actionable insights. Nine specialized views cover token consumption, model preferences, per-developer activity, AI attribution ratios, session trends, cost breakdowns, and tooling adoption.
Why It Matters
AI coding tools generate significant costs and create new patterns in how code is produced. Analytics answers questions like "how much are we spending per developer?", "what percentage of our codebase is AI-generated?", and "which models are most effective?" — with data derived directly from captured sessions and commits.
All analytics pages share a consistent filtering system (time period, repository, author) and support custom date ranges.
Pages
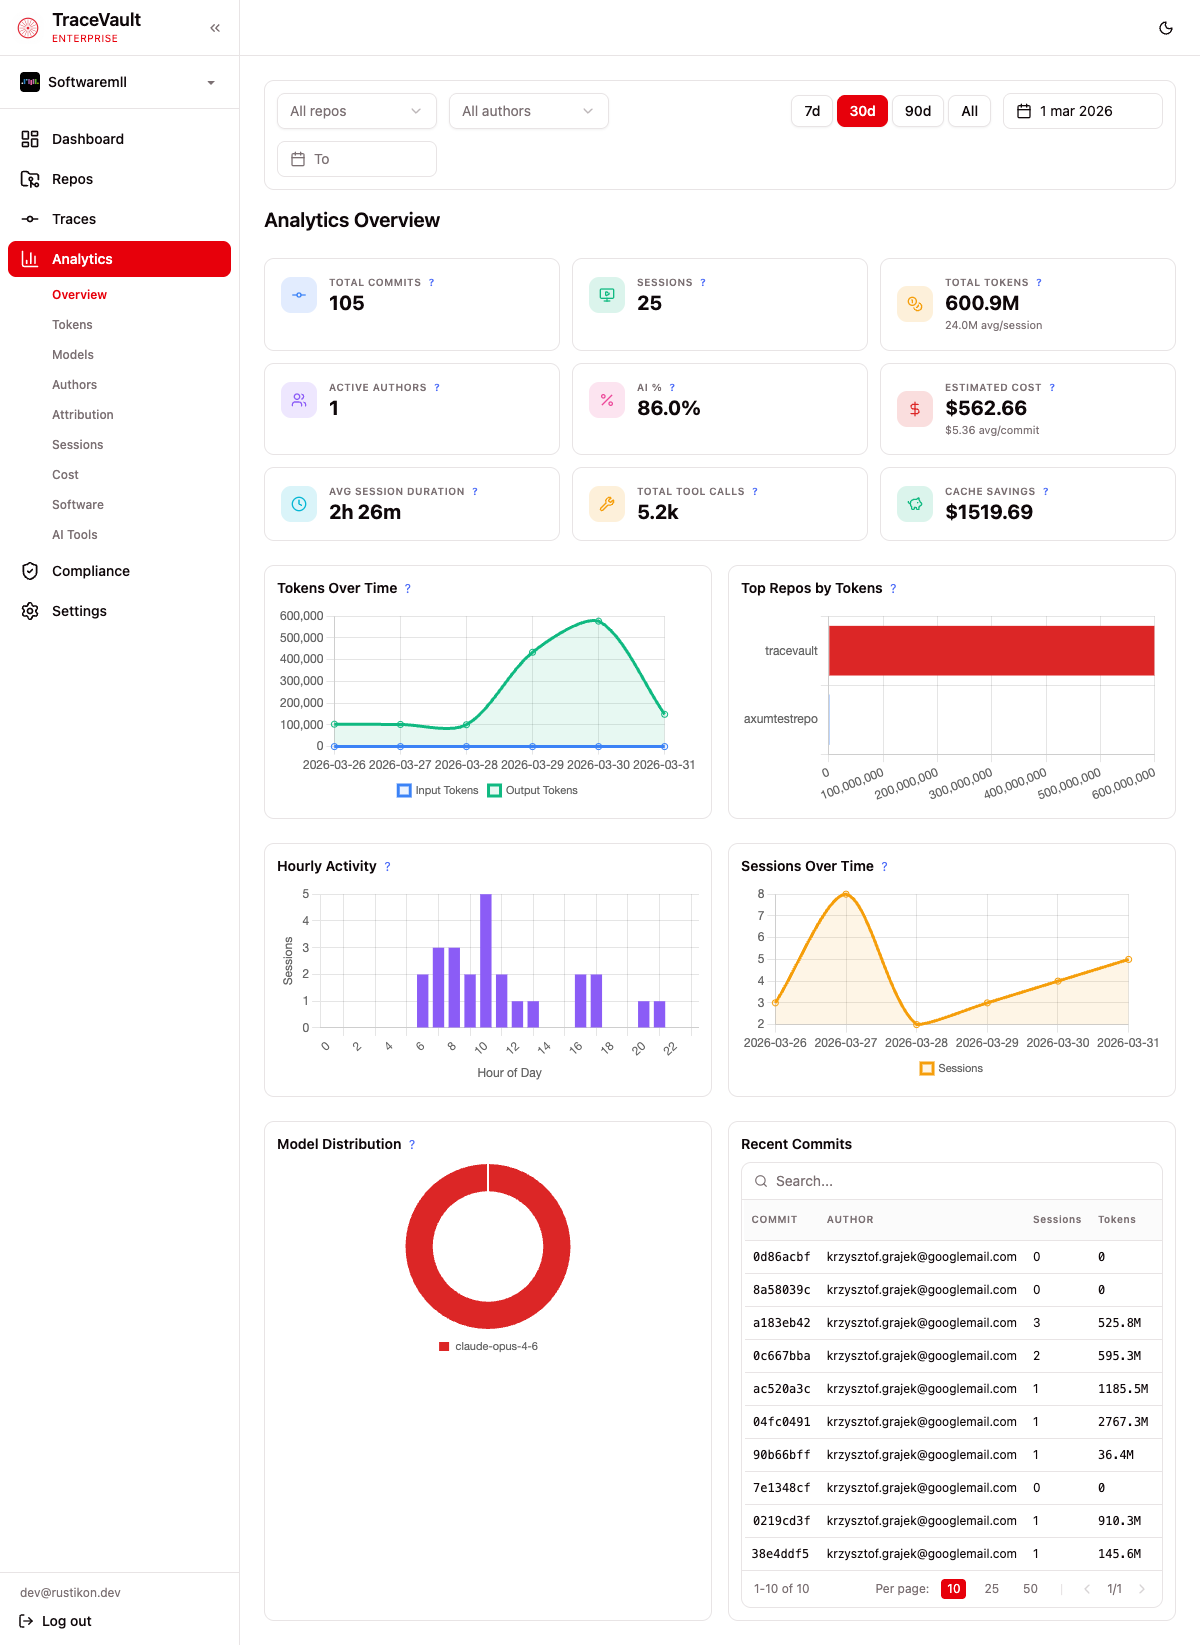
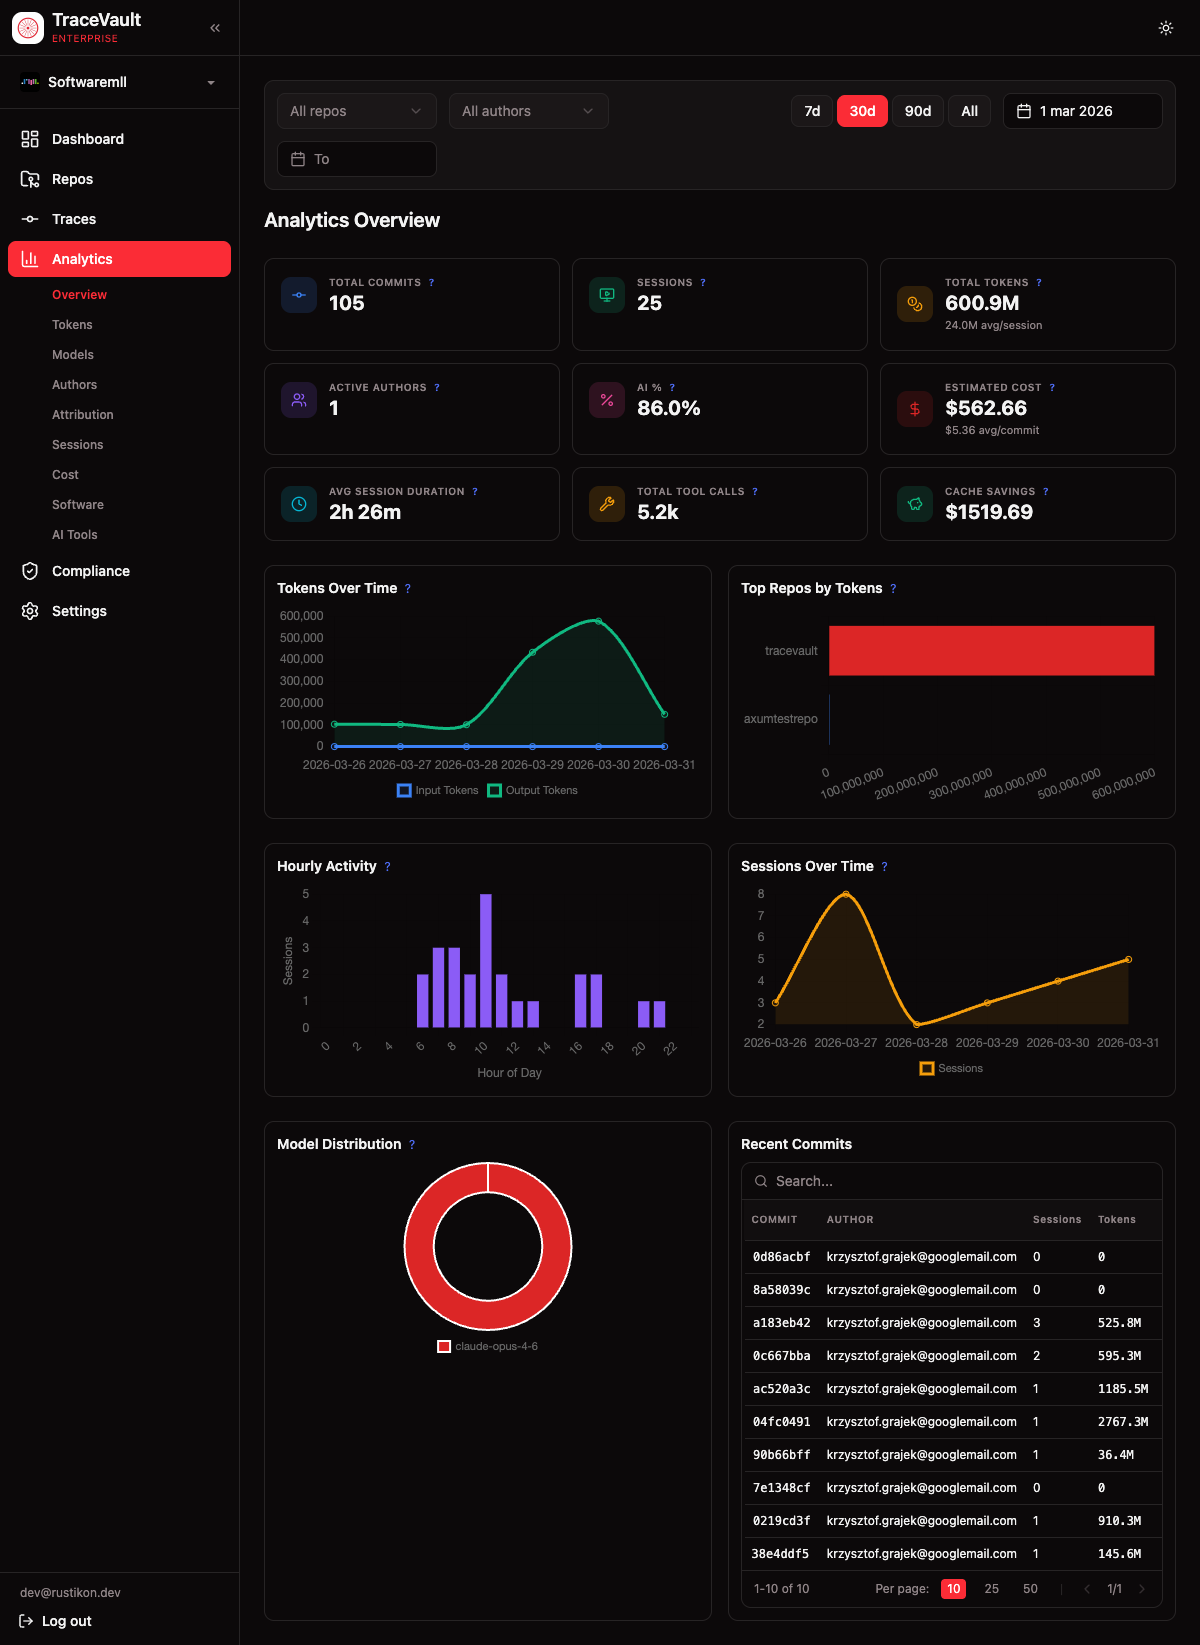
Overview (/analytics)
Summary dashboard with nine stat cards and five charts: tokens over time, top repos by tokens, hourly activity, sessions over time, and model distribution. Includes a recent commits table.
Tokens (/analytics/tokens)
Token usage breakdown with cache read/write tokens and cache savings. Charts show tokens over time and by author. A table breaks down usage by repository.
Models (/analytics/models)
AI model usage with a distribution chart and trend chart showing how preferences change. Includes an author-by-model matrix and a model comparison table (average tokens, cost, cache usage, session duration).
Authors (/analytics/authors)
Per-developer leaderboard sortable by sessions, tokens, cost, AI percentage, duration, and tool calls. Each author's preferred models shown as badges. Click to open a detail page.
Author Detail (/analytics/authors/{user_id})
Individual developer profile with summary metrics, model preferences, top software and AI tools, and a recent sessions table with expandable detail panels.
Attribution (/analytics/attribution)
AI code ratio analysis: total AI lines, human lines, and overall AI percentage. Charts show the ratio over time, by repository, and by author.
Sessions (/analytics/sessions)
Session analytics with total sessions, average duration, messages, cost, and top model. A tool frequency visualization shows proportional usage of the top 12 tools. Full sessions table with expandable details.
Cost (/analytics/cost)
Cost analysis with total cost, cache savings, and average cost per session. Charts show cost over time, by model, by repository, and by author. Enterprise edition.
Software (/analytics/software)
Developer tooling analysis: total unique CLI tools, most popular tool, and a proportional bar of the top 12. Links to AI tools for MCP server and skill group data.
AI Tools (/analytics/ai-tools)
AI-specific tooling covering MCP servers and skill groups with proportional bars and sortable tables showing name, usage count, and user count.